Your cart is currently empty!
Convert Opinion to Continuous Data For 15 Bucks (Part 1)
We will start with a statement of the obvious. Our quality-related data comes to us in many forms.
Assuming our sensors, measurement systems and measurement methods work well, we often get streams of continuous data that’s useful to assess quality. The analysis of this type of data is usually straightforward. But sometimes, there is no way to directly measure important quality characteristic and instead, we rely on the opinion of customers or experts. Here are a few examples:
- Appearance of plated or anodized surface
- The edge quality of foam cut by waterjet
- The “feel” of an arborist rope
- How carpet feels underfoot
- The texture of a material or surface
- First impression of a new pair of shoes
- Taste
For assessments like this, we often use an arbitrary integer scale (1 to 5 or similar), an ordinal scale (Likert, good-better-best, etc.) or perhaps a comparative approach. However, there’s an arguably better method that doesn’t seem to be in widespread use, but perhaps it should. That is, convert expert opinion to numerical data.
A Case Study: The Characteristics of an Arborist Rope
Arborist work is inherently dangerous, and arborists are understandably particular about the quality and performance of their chosen ropes. Figure 1 demonstrates the reasons why.

Meanwhile, making arborist ropes is a complex process. There are many design/process factors (X’s) including fiber type, fiber count, twist length, twist back tension, number of strands, braiding method, braiding back tension and the like. At the same time, there are many quality characteristics of interest (Y’s). Figure 2 is a generic sketch of the process factors. Table 1 provides a list of typical Y’s for arborist ropes.

| Quality characteristic | Standard measurement method available? |
|---|---|
| Break strength | Yes, tensile tester |
| Elongation | Yes, extensometer |
| Color | Yes, spectrophotometer |
| Lifetime | Yes, accelerated aging & reliability studies |
| Lot-to-lot consistency | Yes, IMR and XBar-R charts |
| Rope feel | No |
As it turns out, there is more to a good arborist rope than strength and elongation. In fact, a key property is the way the arborist rope feels in the hand. As indicated in Table 1, there is no way to directly measure this highly subjective property. The Voice of the Customer is something like “I don’t like the way the rope feels went I’m ascending or descending a tree”. And sadly, there’s no such thing as a rope feel-o-meter.
As a result of this perceived measurement impasse, many designers will modify the factors under her/his control and assess the resulting rope feel using opinion, typically by running samples around the Engineering, Sales and Field Support offices. This method often yields decent results but certainly not the best possible results. The only way to get the best possible results is to develop a statistical model for a continuous numerical assessment of rope feel. Here’s how.
First, setup & validate a custom measurement system
For the measurement of rope feel on a continuous scale, the following system & validation method works extraordinarily well.
Materials & setup needed
- A flat surface
- Good lighting
- 3-meter tape measure
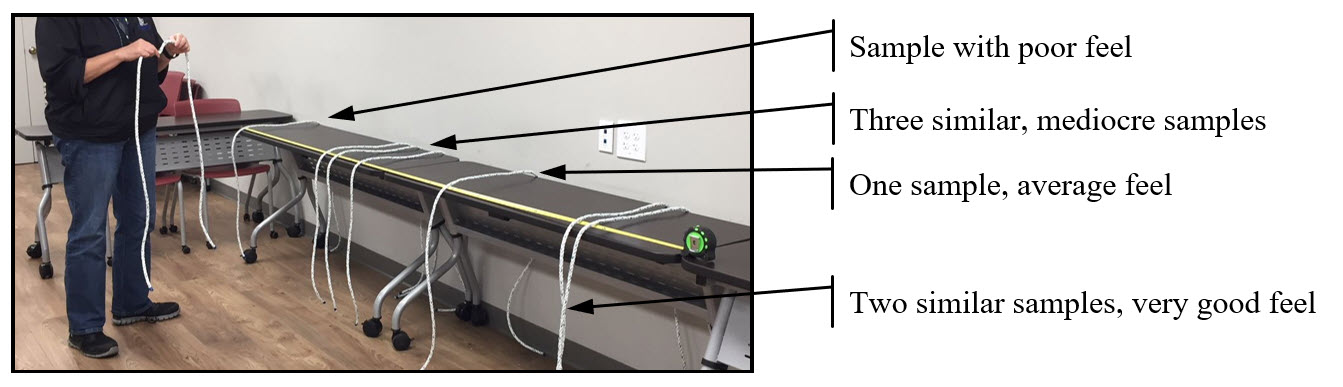
- Setup as shown in Figure 3

Assessment & validation method
- Start with a formal Measurement Systems Analysis (EMP or Gage R&R)
- 7 ropes of varying feel, 3 experts, 3 randomized, blind measurements per expert
- The expert places the sample under test along the 3-meter scale based on her/his assessment. Ropes rated at or near 0 cm are poor, ropes rated at or near 150 cm are average while ropes rated above 250 cm are excellent. A rating of 300 cm is perfect.
- Here’s the important part: the expert then re-evaluates & adjusts the proportionate spacing between samples to reflect her/his opinion. For example, a sample placed at 210 cm would be similar in characteristics, but slightly worse than a sample placed at 225 cm. Conversely, a sample placed at 125 cm would be significantly worse than a sample placed at 225 cm.
- Record the value, in centimeters, for each sample.
- Reset the samples for the next measurement.
- If all goes, MSA-wise, we can use the measurement system to collect DOE response data and get a statistical model indicating the best process operating conditions. This is product design heaven.
Visually, MSA results might look something like Figure 4, where we use a Variability Chart to see a reasonably strong signal compared to measurement noise.

Numerically, results might look like Figure 5 where we see an Intraclass Correlation (IC) of about 79%. This is the % of variation explainable by the difference in the rope samples (i.e. what we really want to understand). The balance of 21% is uncertainty that comes from the measurement system itself (operator repeatability, reproducibility, etc.).

Typically, an IC of 79% would be acceptable for experimental design purposes, but a word of caution is needed. The end game is a good business decision and statistical results must be put into their proper context. In this case study, the IC was viewed considering safety risk, business risk and the importance of the product and, by consensus, the development project moved forward.
For those that are not in the rope-making or similar industry, fear not. Experience indicates this same measurement approach is highly suitable for nearly all opinion-based quality characteristics. I’ve used it countless times over decades with great results. Best of all, once demonstrated within an organization, others begin to use it too.
Next time, we’ll finish the interesting case study and see the awesome benefits of opinion-based continuous data for process optimization.
One response to “Convert Opinion to Continuous Data For 15 Bucks (Part 1)”
-
Wow, this is really, really useful.
We’ve always used a Likert scale or scale of 1-10 or other ordinal approach. This approach is MUCH BETTER.
Leave a Reply