Your cart is currently empty!
Surface Temperature Data Quality Suspect Casts Doubt on “Global Warming” Hypothesis
The Obama administration has proposed, and the House of Representative has recently passed, sweeping legislation to deal with the problem of climate change or, more specifically, global warming. The problem is supposedly that human activity is releasing CO2 and this in turn is causing catastrophic increases in global temperatures. This hypothesis is supported in part by data from ground-based temperature recording stations situated around the world. The United States has 1,221 stations scattered across the continent and it is believed that the data obtained from these stations is among the most reliable and accurate available.
A recent report by the Surface Stations Project casts serious doubt on this assumption. Volunteers for the project have to date examined, photographed 819 of the stations and rated 807. Ratings are based on the Climate Reference Network Rating Guide—adopted from NCDC Climate Reference Network Handbook, 2002, specifications for siting (section 2.2.1) of NOAA’s new Climate Reference Network:
- Class 1 (CRN1): Flat and horizontal ground surrounded by a clear surface with a slope below 1/3 (<19deg). Grass/low vegetation ground cover <10 centimeters high. Sensors located at least 100 meters from artificial heating or reflecting surfaces, such as buildings, concrete surfaces, and parking lots. Far from large bodies of water, except if it is representative of the area, and then located at least 100 meters away. No shading when the sun elevation >3 degrees.
- Class 2 (CRN2): Same as Class 1 with the following differences. Surrounding Vegetation <25 centimeters. No artificial heating sources within 30m. No shading for a sun elevation >5deg.
- Class 3 (CRN3) (error >=1C): Same as Class 2, except no artificial heating sources within 10 meters.
- Class 4 (CRN4) (error >= 2C): Artificial heating sources <10 meters.
- Class 5 (CRN5) (error >= 5C): Temperature sensor located next to/above an artificial heating source, such a building, roof top, parking lot, or concrete surface.”
The bottom line is that 89% of the sites examined to date are in categories 3, 4, or 5. In other words, they fail to meet established NOAA requirements.
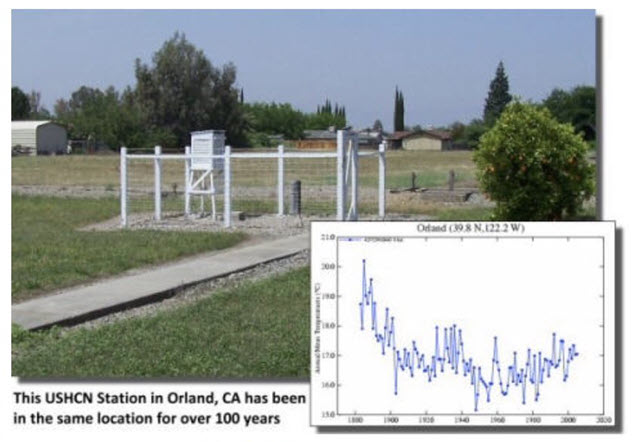
A logical question would be, does it matter? Evidence indicates that it does. For example, here’s a photograph of a site that meets the standard:

A site that meets NOAA specifications.
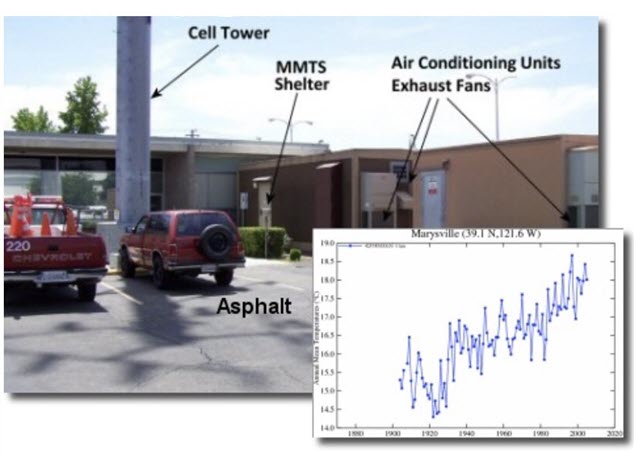
The chart shows that the temperatures recorded by this station have actually declined over time. Compare this to the results from this poorly sited recording station:

A site that fails NOAA siting requirements.
The chart clearly shows warming. However, the cause of the warming is most likely the changes in the quality of the site over time, not due to human-induced increases in CO2.
In the business world we use quality and Lean Six Sigma to help us make good decisions based on facts and data. The process used is called DMAIC, or Define-Measure-Analyze-Improve-Control. In the Measure phase we assure that we have valid, reliable data before moving on to analysis and improvement. This is a lesson that policy makers in Washington and elsewhere should learn before embarking on policies that will cost trillions of dollars.
4 responses to “Surface Temperature Data Quality Suspect Casts Doubt on “Global Warming” Hypothesis”
-
Excellent! In our current culture of blame, someone that questions the popular conclusion of global warming is subject to open and hostile ridicule. To suggest that global warming might be caused by solar variations, we would be without a villain to blame.
Another variable not mentioned is that many of the weather stations were rural when they were installed. Now they are urban. One might expect a temperature increase. Weather stations are not distributed in geographically meaningful locations, they are placed in sociologically important places, cities.
I realize that this a summary article and not a full report. The scale of the graphs are difficult to read. However the bottom chart appears to go back to 1920, yet the building appears to be much newer. Surely the data is from several locations. The 1950 data could be influenced by air conditioners, but not earlier data.
Also, the two charts do not cover the same time or temperature scale. The last “most recent” section of both charts have the same approximate rate of rise. The bottom chart does not cover the time frame in which the top chart shows a temperature drop.
If only the 1930 sections of data were presented with identical scales, it would be less convincing, in fact it might support the warming theory.
-
Identical scales and well-understood corrections for outliers – for example, if a standard adjustment was made for the amount of time the air conditioner exhaust is blown over the gauges each day during specific seasons – would make the data more pertinent. The skeptic in me, however, worries that those types of corrections will be too numerous and complex to make the results repeatable and reproducible…
-
We have a problem here at work where we measure the outcome, and try and make decisions on whether there is significant change. It doesn’t work well, because the failure rate is too low. We have to look deeper and have been monitoring a variable first-time-test value instead of last-time-fail yea or nay. The first-time-test values have a distinct pattern that can be an early warning of failures to come.
Perhaps instead of constantly arguing about global warming, which is so small it is difficult to measure reliably, we should look at other signals that we can affect.
For instance, NPR had an interesting interview yesterday with a marine biologist studying the affects of CO2 absorbing into the ocean – causing an increase in acidity due to the creation of boric acid. http://www.npr.org/templates/story/story.php?storyId=111807469
CO2 may or may not cause a measureable and statistically significant increase in global temperature, but it does cause measureable acidity increase in the ocean.
-
Great comment, Dan. My question is whether we are merely substituting one metric (air temperature) for another (pH.) In either case we must assure that the measurements meet the quality criteria of accuracy, repeatability, non-linearity, etc.. The point of the original post is that these criteria have not been met in a substantial number of the measuring stations.
-

Leave a Reply