Your cart is currently empty!

Manual Reviews of Medicaid Claims
Background
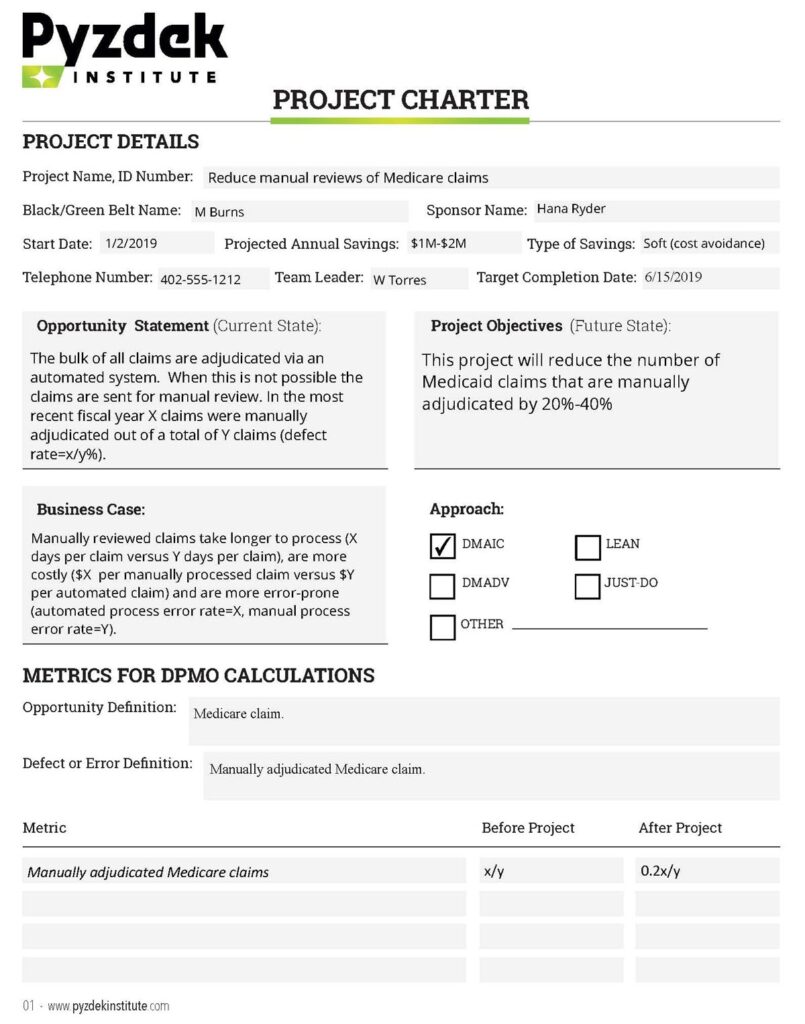
Our business provides administrative services to dental practices. One service is to process insurance claims for Medicaid patients. Processing involves adjudication of claims to determine eligibility. The bulk of all claims are adjudicated via an automated system. However, when this is not possible the claims are sent for manual review.
Recognizing an Opportunity
Manually reviewed claims take longer to process (X days per claim versus Y days per claim), are more costly to process ($X per manually processed claim versus $Y per automated claim) and are more error-prone (automated process error rate=X, manual process error rate=Y). This project will reduce the number of Medicaid claims that are manually adjudicated. A manually adjudicated claim is considered a “defect” for the purposes of this project.
Define Phase
Preliminary Scope of Project
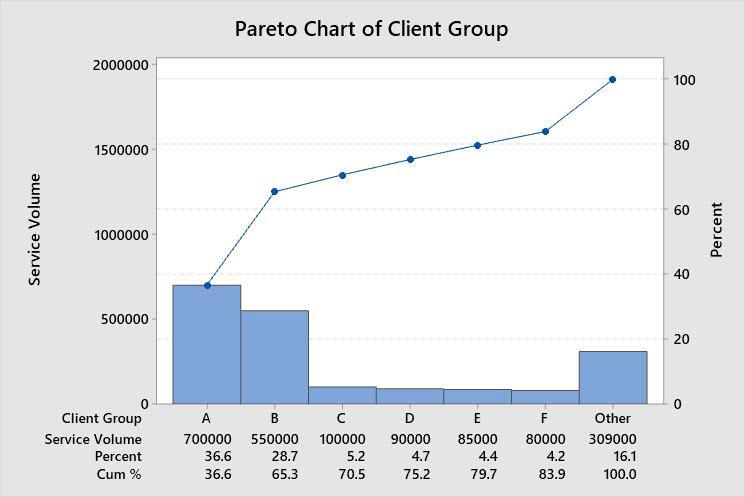
In the most recent fiscal year X claims were manually adjudicated out of a total of Y claims (defect rate=x/y%). A Pareto analysis revealed that the top 2 client groups accounted for Z% of the claims. Client A alone accounted for A%, and client B for B%. The remaining n client groups accounted for less than C% each and C2% combined. Our project will focus on clients A and B, with an eye towards improvements that can be applied to the remaining clients. Reasons for the differences between the processes for clients A and B and the remaining clients will be investigated for improvement ideas. Our initial estimate is that the project will reduce the defect rate by 20%-40% while maintaining current levels of customer satisfaction. This would impact our leaders’ goal of increasing gross margin by improving gross margin by $1M-$2M annually.
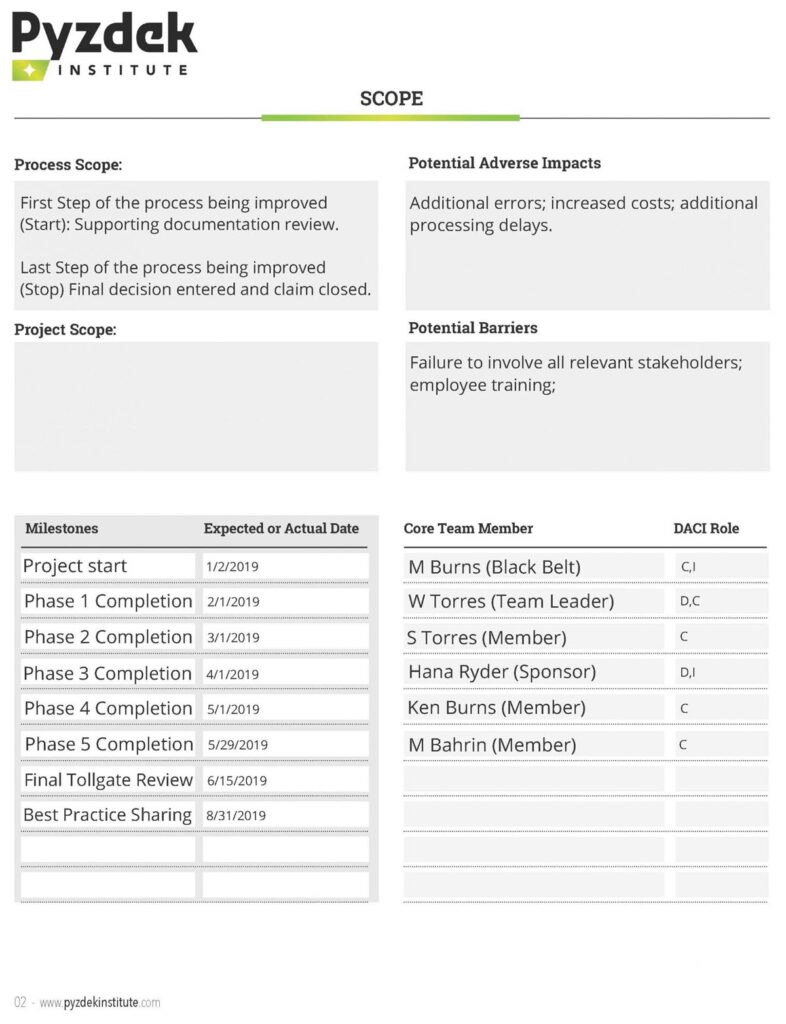
Project Charter
The information above was used to develop the project charter shown below.
Choosing the Project
A more detailed analysis of the number of claims manually adjudicated by client group produced the Pareto diagram in Figure 1, which confirms our decision to focus on client groups A and B.
Develop the Project Plan
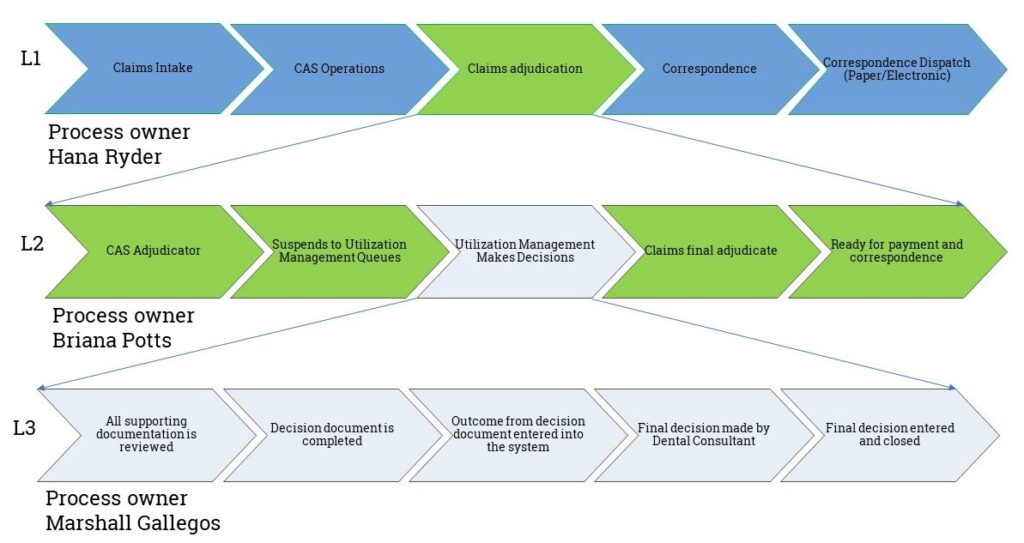
The project timeline was created using the broad milestones timeline from the project charter. Tasks were listed and assigned to members of the core team. A high-level process map (L-map) was created showing which process elements were involved, see Figure 2-Process L-map. We do not go all the way to the senior leadership process level, although this option was considered. However, we did link the project’s deliverable to the leadership’s goals in the preliminary scope statement.
Voice of the Customer (VoC)
It is important to know what customers think about this process. We used the Kano model of customer satisfaction. Ideally, we would get this information directly from customers. We took a shortcut and speculated about what customers want. The Pyzdek Institute did not approve, but allowed it anyway!
- Basic Quality (Must-have): Process authorizations at 95% accuracy while meeting contractual/regulatory turnaround time requirements, typically within 2 business days of receipt.
- Expected Quality (more is better): Process authorizations > 95% accuracy while meeting contractual/regulatory turnaround time requirements, typically within 2 business days of receipt.
- Exciting Quality (better than expected performance): Process authorizations > 99% accuracy ahead contractual/regulatory turnaround time requirements, typically within 24 hours of receipt.
Stakeholder Analysis
Stakeholders were listed and their interests in the project considered. Interviews were conducted by the team members to determine how supportive each stakeholder was of the project. The team estimated the stakeholder’s influence within the organization, current support for the project, and the team’s desired stakeholder support for the project. Since the COO was 100% supportive, we did not observe any other stakeholders that needed convincing of the value of this project. Therefore, we did not prepare a plan for getting stakeholder support. However, we did prepare a stakeholder communication plan.
Measure Phase
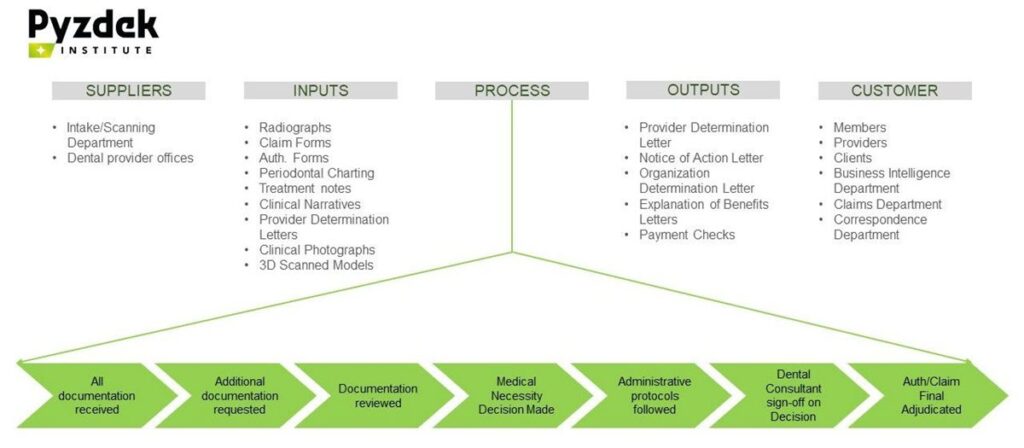
To begin validation of our measurement system we developed the SIPOC diagram shown in Figure 3. The team reviewed all input and output sources and confirmed their validity.
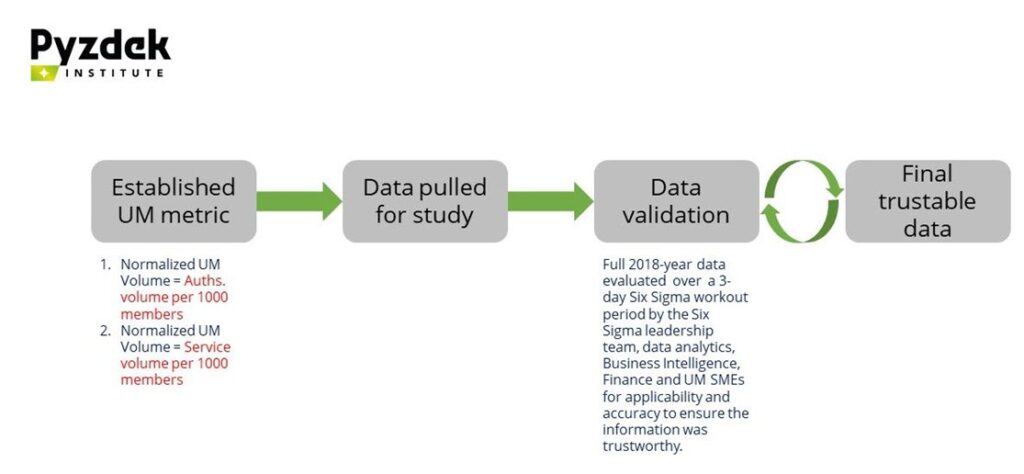
Our chosen metric, utilization management, was validated for a recent year during a workout workshop. Applicability to our project and accuracy was evaluated to confirm that the information was trustworthy.
Using our validated data, we first examined the time series for a 39-week period. The data for our two chosen metrics (authorizations per 1000 members and service volume per 1000 members) were plotted on control charts (Figure 5). The charts showed an out-of-control pattern: too many points alternating up-and-down. This was determined to be due to the volume of auths received from provider offices, which was deemed not to be an actionable special cause of variation. Otherwise the metrics showed that the processes were in statistical control but at too high a level. Thus, the need for a system change was indicated.

Cascade Ys to CTQs
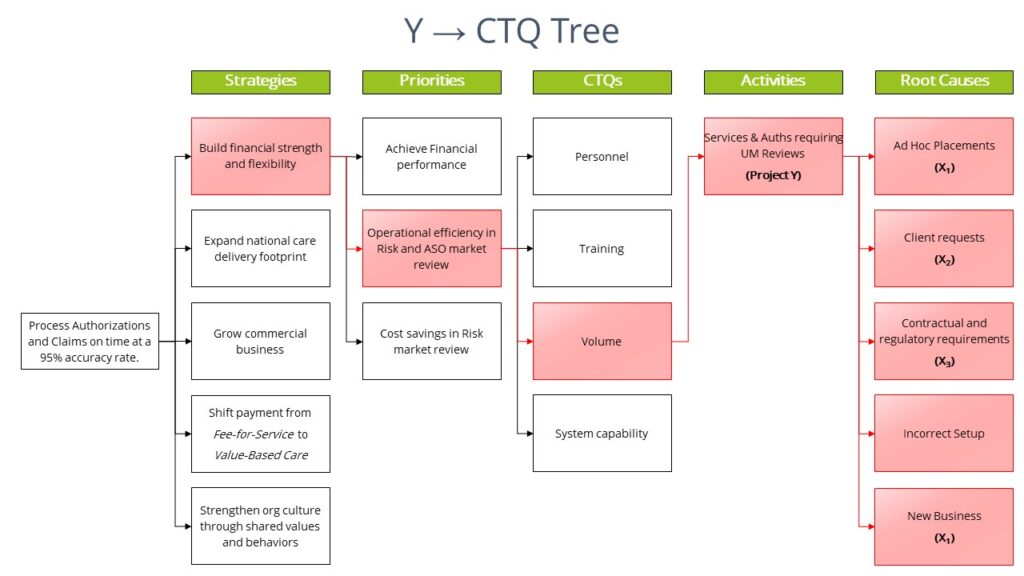
In Lean Six Sigma we do not “manage by results”. Instead we drill down from end results to the critical-to-quality (CTQ) root causes that produce the end results, then act on the root causes. We do this by identifying the transfer function that links the result of interest to the root causes. For our project we believe that the transfer function was or Y=f(X1, X2, X3) where:
Y= Services & Auths requiring UM Reviews
X1=Business Rules (Internal company rules)
X2=Client Requirement (State, Health plans, etc.)
X3=Regulations (Medicaid, CMS rules)
I.e., Services & Auths Requiring UM Review (Y) = f(Business rules, Client Requirements, Regulations).
We constructed a Y→CTQ Tree. The project Y is identified at the Activities level of the drill-down. The diagram in Figure 6 shows only the path to the Y for illustrative purposes to indicate the linkage between our project and the leadership’s goals. The root causes on the right-hand side of the figure deemed to be actionable for our project are identified with an X.
Analyze
Determine Baseline
To begin the analyze phase we identified the process baseline for our project Ys. The baseline establishes the condition of the process before the Lean Six Sigma project and provides information that can be used to measure the amount of improvement. The baseline data shows non-normal distributions, therefore non-parametric analytic tools were required to validate results. Since this is a Lean Six Sigma Green Belt project, the assistance of a Master Black Belt was required. We used Mood’s Median test along with the box plots to evaluate the baseline. Baseline analysis revealed that the processes were operating at the following median levels: UM Services per 1000 members = 3.198 and UM Auths. per 1000 members = 1.141. This is our starting point. Our goal is a 15% reduction in UM Auth volume per 1000 members in the Government ASO business segment.
As-Is Process Map
The team identified the as-is process map (Figure 7). The map is used to help guide discussions of improvements.
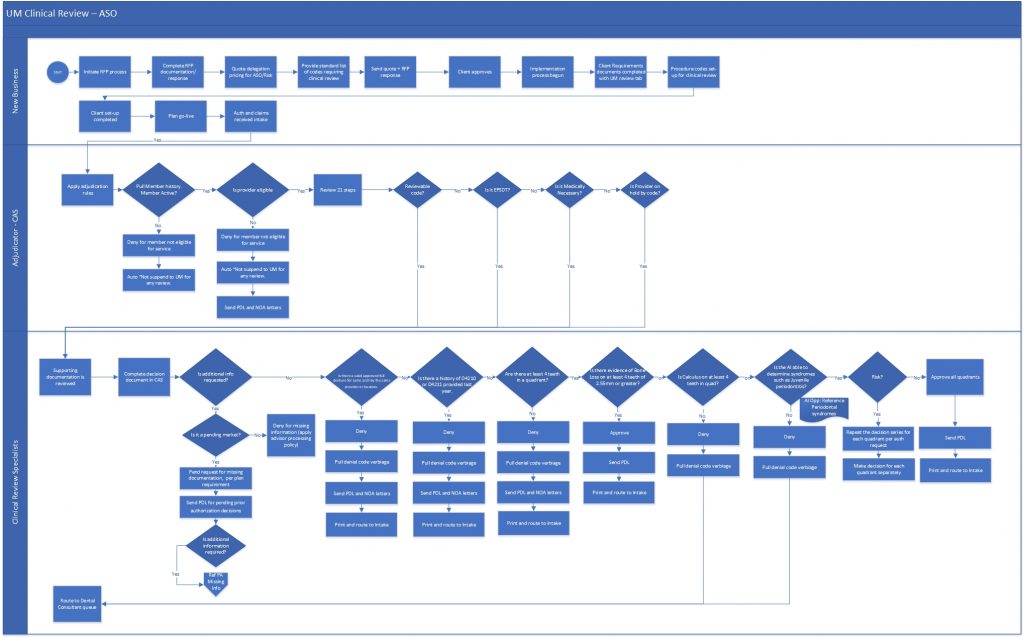
The improvements are shown as “opportunities” on a modified version of the original as-is map.

Cause-and-effect (Ishikawa) Diagram
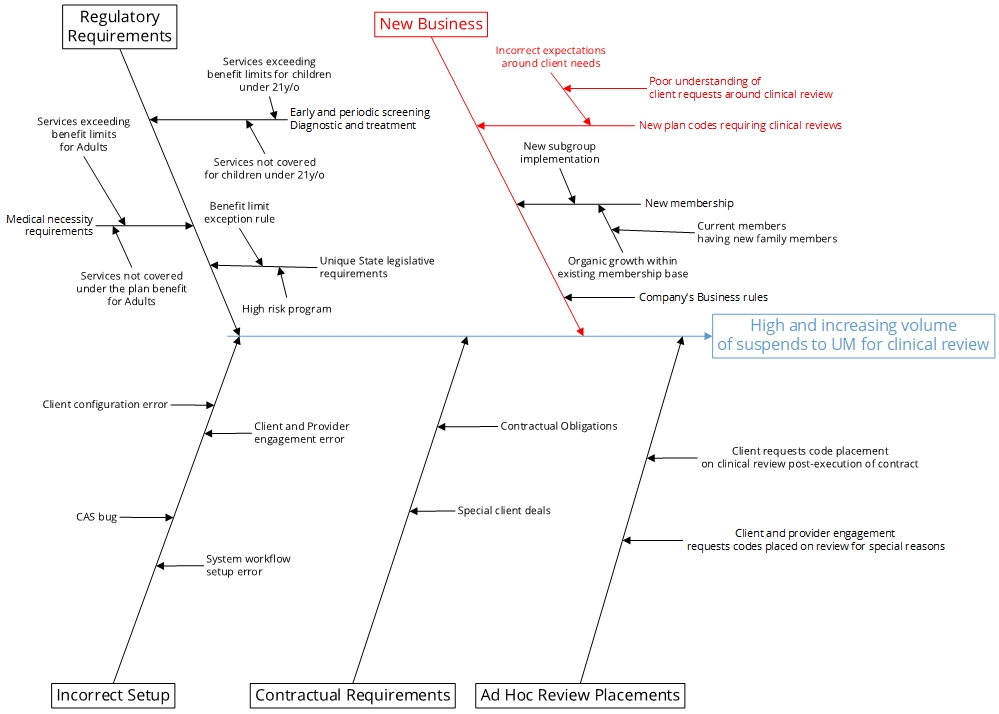
A cause-and-effect diagram was created showing the drivers of high and increasing volume of suspends to UM for clinical review (Figure 9). Analysis of the existing process revealed:
- Utilization Management review volume is significantly higher on the ASO in comparison to the Risk side.
- New business implementation process follows a standardized approach for all client contracts.
- There is no differentiation in the approach for placing codes on clinical review between ASO vs Risk based contracts.
These new insights provided information that the team used to identify specific improvements.
FMEA
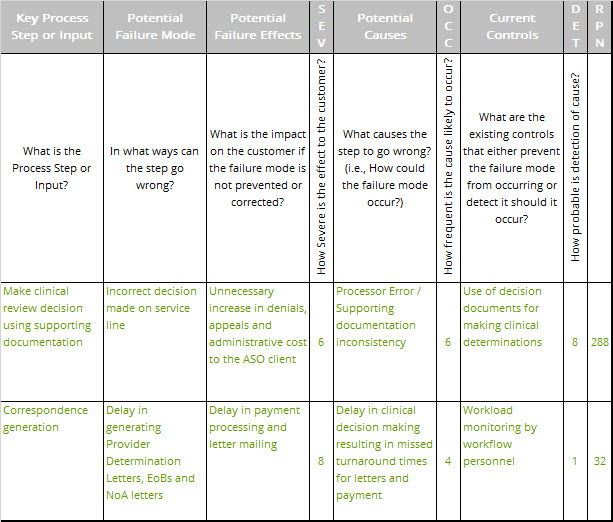
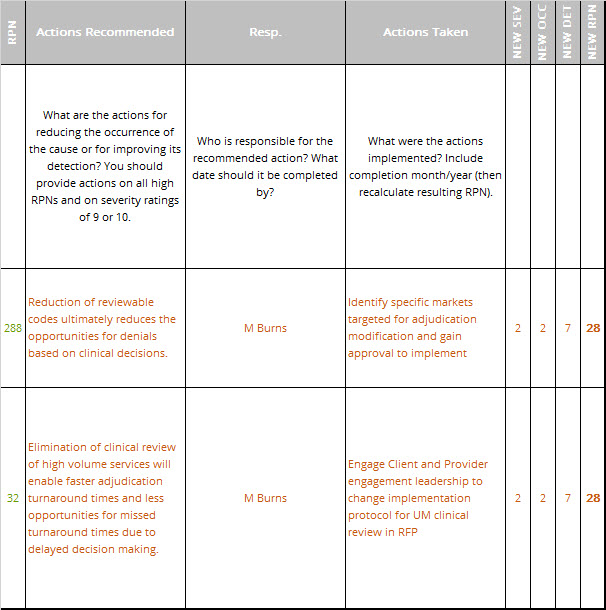
Next, we performed an in-depth failure mode and effects analysis (FMEA) for the proposed changes. An excerpt of the FMEA is shown in Table 1. The FMEA was used to modify the design plans for the new process to reduce problems.
Improve Phase
Cost Benefit Analysis
We determined that volume could be eliminated from clinical UM review using data from our Measure and Analyze phases. Current finance-approved FTE calculation model was used to estimate the amount of workmanship needed to complete the volume. Salary of each FTE was applied to the count to determine the efficiency savings in real dollars. No new labor expense as the project uses existing resources. Labor capacity freed up will be utilized in other business segments. No new IT infrastructure is needed.
Conclusions
- UM is receiving numerous unnecessary non-value added suspends for clinical review which the clients are not paying for.
- Output of these reviews in many cases creates additional appeal reviews leading to unnecessary rework.
- There is a large untapped residual opportunity that could not be implemented as only approximately X% of the existing opportunity was approved for implementation at this time.
Updated FMEA
The FMEA performed in the Analyze phase was updated to assess the risk of the improvement plan, Table 2. The new risk priority numbers (RPNs) are shown to be considerably below those for the original process, indicating a much improved customer and employee experience.
Pilot Results
- Pulled report extracts of historical volume pattern for pilot market Jan – Jun 2019 (Baseline data from Figure 5).
- Implemented changes in staging environment and tested changes to ensure deployed script is performing as expected.
- Deployed script for pilot groups in live production second week of July 2019.
- Monitored volumes for pilot groups over July and August (See results in Table 3 below).
- Performed sample audits in production to validate true cause of volume reduction is the S90 script deployed.
- Reported positive results to management.
| Month | Jan | Feb | Mar | Apr | May | Jun | Jul | Aug |
| Volume | Totals | Totals | Totals | Totals | Totals | Totals | Totals | Totals |
| IL – CC | 3948 | 3753 | 4002 | 4011 | 4220 | 3581 | 2388 | 1592 |
| IL – HFS | 4123 | 3991 | 4558 | 5305 | 5371 | 4342 | 2432 | 1621 |
| SC- HC | 2109 | 2102 | 2208 | 2109 | 2170 | 1980 | 1609 | 1073 |
| VA – M | 128 | 169 | 206 | 251 | 217 | 213 | 58 | 38 |
| VA – SFC | 8832 | 7924 | 8896 | 9464 | 8431 | 8511 | 5163 | 3442 |
Implement Full Scale Changes
- Identified proposed solution and markets for implementation.
- Obtained CPE and organizational leadership approval for implementation.
- Implemented solutions through system configuration and workflow team.
- Tested and validated solutions through Utilization Management team.
Control Phase
- Built interim tracking dashboard to evaluate the results on a go-forward basis, final tracking dashboard is being built through the Business Intelligence team to track results as part of UM enterprise process reporting (See partial snip in Table 4 below).
- Built new business protocol for the Client Engagement team for use in ASO rate quotes.
- Implemented documentation protocols for inclusion in the client Master Client Requirements Document for ASO clients.

Results
The I-MR charts (top two charts in Figure 1) show a substantive downward change in the volume of suspends to UM after deployment of the change. Similarly, the box plots also graphically shows a substantive downward shift in the volume with almost no overlap (bottom charts in Figure 10).
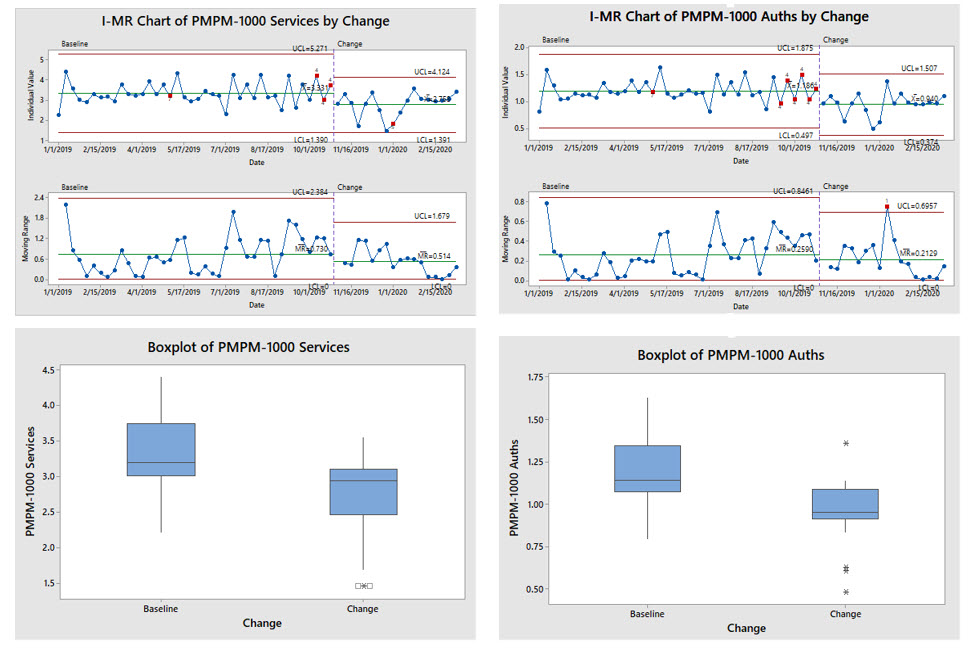
We ran the Mood’s Median non-parametric test for each of these UM metrics and got a P value of 0.005 for the PMPM-1000 Services and P value of 0.001 for PMPM-1000 Auths, both pointing to the fact that the null hypothesis should be rejected thus, we will go with the alternative hypothesis that the medians of both datasets are not equal. This validates the reduction in UM volume, ~17% Improvement in Median of Auths/1000 Members per month. This exceeded our improvement goal of 15%!
Financial Benefits
- Clinical Review Specialists = 9.2 FTEs ($501,600)
- Internal Consultant = 2.1 FTEs ($451,500)
Benefit: This project has freed up capacity to enable business growth.
This freed up capacity is currently being deployed to the Risk segment of the business for additional profit generation yielding a $3.6M gross margin increase. This contributes to our senior leadership’s top-line goal.
Transfer Ownership
New process owners were trained in use of the new process and provided with the tools needed to maintain the gains. Dashboards were provided that let them monitor and control the new processes.
- Metrics developed in dashboard by BI in Microsoft Power-BI.
- Metric dashboard ownership and training for UM Reporting to leadership on a go forward basis.
- Standard Operating procedures developed for Client and Provider Engagement team and training executed for future RFP and implementations.
Appendix
Stakeholder Analysis
Purpose:
To identify who your stakeholders are, what roles they plan in making decisions and how you will involve them to gain shared vision.
How to Use:
First, identify the stakeholder and describe his or her role using the DACI model. Next, define his or her current level of support and the level of support you need from him or her. Finally, identify what you want from him or her and describe the concerns and wins this person might have regarding your project. Determine how you will involve him or her based on this.
DACI
- Driver – Drives decision process, achieves shared vision with stakeholders and commitment to execution.
- Approver – Ultimate decision authority, established pre-decision.
- Contributor – Contributes input and perspective pre-decision.
- Informed – Informed post-decision for awareness and impact.

Leave a Reply