Recently some prospective clients asked me for a demonstration project to help them determine if Six Sigma would be a good idea at their company. I advised them against it. Such a demonstration only shows management’s lack of commitment to the success of Six Sigma. Although philosophical issues are important, there are more concrete problems with such “toe in the water” projects. In particular, major quality improvements can sometimes yield little or no bottom-line cost impact. The result of such projects is to convince management that Six Sigma adds cost without adding value. This belief is, of course, totally wrong. But it’s also a logical result of the demonstration approach itself.
For example, Sam was a Six Sigma enthusiast. He’d studied its use at several major companies and was convinced that it would save his company, which we’ll call Acme, millions of dollars. The hype had also caught the attention of the senior leadership at Sam’s company. But before diving headlong into Six Sigma, they wanted Sam to conduct a demonstration project to see if the savings reported by the press could actually be obtained at Acme.
The company’s main product was a complex assembly, which Acme sold to a large aerospace customer. The assembly- manufacturing process was in statistical control and producing an average of 10 defects per assembly. With management’s support, Sam documented the cost of noncompliance to be about $1,000 per assembly. After months of diligent effort, Sam’s Six Sigma team was able to redesign the process. To their delight, they were able to reduce the number of defects per assembly by a full 50 percent, from 10 defects per assembly to five.
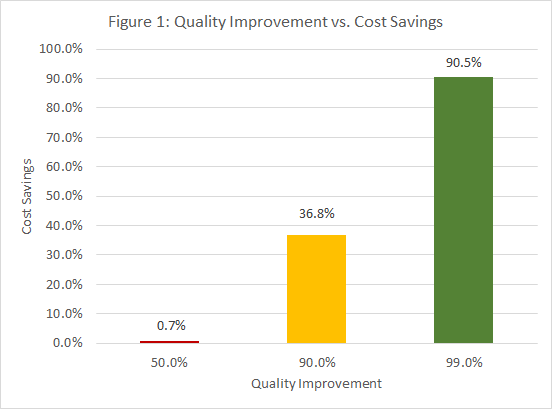
Management was also interested in the project. But the accounting department had carefully monitored the costs for the assemblies, and to everyone’s surprise, accounting found only a minuscule 0.7-percent cost savings.
Based on these results, leadership’s conclusion was simple: Quality doesn’t pay. The company won’t pursue Six Sigma any further.
Did accounting make a mistake? In a word, no. The problem arose because Sam measured quality as defects. The truth is that most costs are incurred because of defectives rather than because of defects. (Thanks to Mikel Harry for this insight.) A defective is a unit of product or service that contains one or more defects. Whether a unit contains one defect or several is irrelevant. Customers generally react to defective units by returning them for warranty repair, refunds or other options. Internally, defective units must be identified through costly inspection and then routed through equally costly rework processes, or else scrapped entirely. A unit with one defect costs nearly as much as one with several.
Mathematically, the Poisson distribution describes the relationship between defects and defectives. The equation for the Poisson distribution is:
P(x)=\frac {\mu^{x}e^{-\mu}}{x!}In the equation, x represents the number of defects in the sample, and P(x) means the probability of finding x defects. For example, P(1) is the probability of finding one defect. The symbol m is the average number of defects per unit of product or service. For Sam’s project, the average assembly had 10 defects before Six Sigma was applied, so m = 10. The efforts of the Six Sigma team reduced the average number of defects per assembly to 5, for a 50 percent improvement in quality.
Let’s plug these numbers into the equation and see what happens. Because we are interested in the probability of an assembly being defect-free, we want to know P(0) for each of the two quality levels. Before Six Sigma, with m = 10 we get
P(0)=e^{-10}=0In other words, there were virtually no defect-free circuit assemblies before applying Six Sigma methodologies. After applying Six Sigma, the probability of getting a defect-free assembly at Acme was
P(0)=e^{-5}=0.007=0.7\%Thus, a 50-percent improvement in the quality level as measured in defects produces only a 0.7-percent improvement in the number of defect-free circuit assemblies. A complete graph of this relationship is shown in Figure 1.

Figure 1: Quality Improvement vs. Cost Savings
The real cost-reduction benefits only start to appear when quality reaches very high levels. This relationship explains the commonly observed phenomenon of quality programs not paying off in the short term. Only when companies stick with it long enough to begin to approach Six Sigma quality levels do they get the desired results. Too often, “toe in the water” projects scare companies out of the pool before they even start to swim.


Leave a Reply