We are all fortunate to have the accumulated knowledge of manufacturing industry titans readily available to help us improve processes and reduce costs. In the Lean context, Taiichi Ohno and Shigeo Shingo stand out. They taught us much about the process improvement mindset, visual control systems and the like. Both indicated the need to relentlessly identify process waste and do something about it. We started with the list of 7 Deadly Wastes and eventually added safety and wasted talent as Deadly Wastes #8 and #9.

In the spirit of continuous improvement, The Pyzdek Institute proposes taking that list even further.

The Original List

1) Transport6) Over-production
2) Inventory7) Defects
3) Motion8) Safety
4) Waiting9) Under-utilized talent
5) Over-processing 
Table 1: The Original List

Our proposal

We propose adding other forms of waste to this list and we’ll cover the particulars of the list expansion in future blogs. One example is the waste of bad data.

Meanwhile, to benefit Lean Thinkers everywhere, The Pyzdek Institute has accumulated real-world examples of The Nine Deadly Wastes to make available to Lean Thinkers everywhere. To that end, please post in the comments section below any examples that you’ve encountered. We’ll add them and post downloadable documents to the Pyzdek Institute website. Additionally, please highlight examples where one form of waste causes another (see last bullet point below).

A Brief Overview

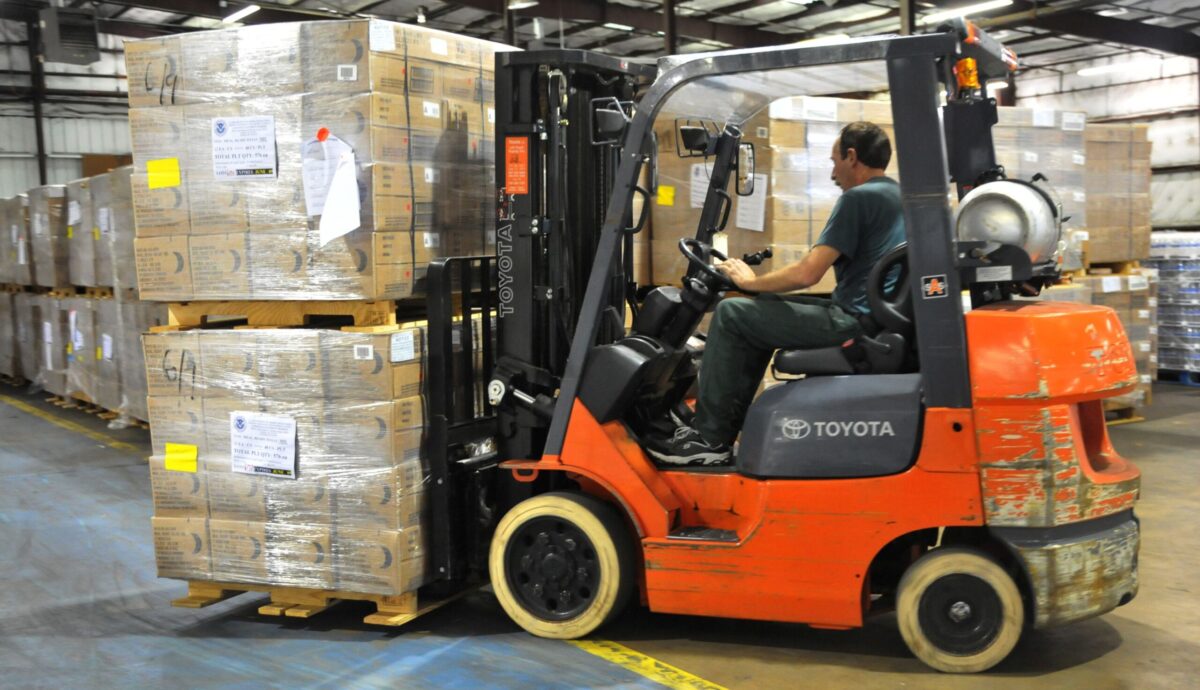
Transport waste is defined as the physical movement of materials that does not add value to the product. Batch & queue process, like the one shown in the photo, are highly susceptible to Transport waste.

Process with long transport paths, courtesy of Wikimedia Commons user Matanya
Photo 1: Process with long transport paths, courtesy of Wikimedia Commons user Matanya

Root causes of Transport waste include poor equipment layout, indirect product workflow, the presence of forklifts and tooling used over large areas of a facility. To identify Transport waste, observe workflow from a panoramic viewpoint, discuss solutions with Process Owners and take action.

Fortunately, we can use Spaghetti diagrams to visualize Transport waste.

Current State

Spaghetti diagram of production line
Photo 2: Spaghetti diagram of production line

Future State

Spaghetti diagram of modified production line
Photo 3: Spaghetti diagram of modified production line

A Partial List, Transport Waste

  • Product damage during transportation
  • Use of forty foot shipping containers, placed at the far side of a parking lot, for raw material storage
  • Move hospital patients from department to department
  • Lack of vertical storage in warehouses increases transport path length
  • Move raw material and parts from line side storage back to a warehouse.
  • Conveyor within work cell
  • Paper documents transported between work areas
  • Machines too close together, thus impede material flow
  • Product is partially processed at one location, finished at another
  • Use of distant suppliers
  • Move extrusion dies, gears and similar tooling from storage racks to work area
  • Stage too much material “just to be safe” at a construction job site
  • Move improperly stored material to a more protected area
  • Poor location of line side material storage
  • Safety hazard caused by fork trucks and pallet jacks (Safety hazards caused by Transport Waste)
distant storage container (courtesy of Wikimedia user Magnus Manske)
Photo 4, distant storage container (courtesy of Wikimedia user Magnus Manske)

Finally, and as a friendly reminder, please add your examples of Transport waste in the comments section below.

Next time: Inventory waste


8 responses to “The Truth About Transport Waste”

  1. Canh Khong Avatar
    Canh Khong

    I love to read this article.

    Photo 2, Steve illustrates transport waste from a process set up.
    Photo 3, Steve suggests how to re set-up the material flow to reduce transport waste.

    Just by presenting the two simple photos, Steve gives one of the good examples of what the transport waste looks like and suggests how we can reduce the waste by just re-setting up the process flow.

    I am waiting to see the next one from Steve: Inventory waste.

    1. Stephen Czupryna Avatar
      Stephen Czupryna

      Thanks for the feedback, Canh.

      As a clarification, the distances in the first Spaghetti Diagram are in meters, and the distances in the second Spaghetti Diagram are in feet.

      I also forgot to mention that the Circle-S icons in the first Spaghetti Diagram are for noted Safety Hazards. With our #1 priority always on safety, it’s important to be on the lookout for hazards while we’re doing time studies, VSM maps, collecting data for control charts or whatever else we’re doing in the production area.

      1. Canh Khong Avatar
        Canh Khong

        Thank you for the clarification Steve.
        I would like to share one of my stories about transportation waste:

        I was an order picker in a warehouse years ago.
        Every morning, my boss gave me a list of items for sales orders that I needed to pick.
        Each sales order had average of 15-20 items on its list. Unfortunately, these items were in different aisles in the large warehouse.

        To start, I drove a forklift back and forth from aisle to aisle to pick up the first item on the list and then move on to the second item, etc., until the last item was picked.

        One day, I thought about “grouping” items per aisle and picking them per aisle.
        So, I drove my forklift in one way (not back and forth) from one aisle to the next. When I got to the last aisle, I had picked all of the items I needed.

        To my surprise, with the new method of picking “per aisle”, I completed my task about 1.5 hours faster than the old way. With the old method, I wasted a substantial 19% of my working time every day!

        Steve mentioned that just simply re-setup of machine location is a way to minimize the transportation waste.
        I would like to add that transportation waste can also be minimized by just simply changing the process.

        1. Stephen Czupryna Avatar
          Stephen Czupryna

          Thanks for the great example Canh. It highlight the benefits of Lean Thinking across an entire organization. Running a warehouse or gathering product to fill orders are business processes and when we improve those processes the results are happier customer, lower costs and steadier employment for everyone.

          Another benefit is that Lean Processes are safer. In your case, the less fork truck distance you travel, the lower the risk of a fork truck incident.

  2. Marilyn Nanquil Avatar
    Marilyn Nanquil

    Here are two common forms of Transport waste in a hospital setting.

    1) Transporting patients through a serpentine path in the hospital because of scheduling conflicts. For example, the patient may have to be taken to the 4th floor for a test, then down to the basement for bandaging then back up to the 4th floor for another test.

    2) Transporting supplies from a supply room to a surgical theater with the leftover (sterile) supplies transported back to the supply room, put into a hold area and then re-stocked to the proper shelf. This also creates a time burden for supply people to keep record of everything, a form of over-processing waste, it seems.

  3. Joe Mazette Avatar
    Joe Mazette

    Transport waste from the bread baking industry

    After baking the bread, it goes by conveyor to a slice machine and packaging. Then it goes to a holding area by fork truck to wait for loading onto a truck. But because of the way the equipment is layed out, the fork has to go a long way around rather then direct. The conveyors and ovens are in the way. I’d say the forks have to travel an additional 100 yards for each pallet. We don’t want to think how much extra time and fuel are wasted. It’s a lot.

  4. Stephen Czupryna Avatar
    Stephen Czupryna

    I just thought of another good example.

    In the extrusion industry, it is common to bleed an extruder. Large mounds of plastic form on the floor below the crosshead and that large puck has to be transported to recycling or disposal bins.

    Here we have multiple forms of waste. This unused plastic is not only scrap that directly adds to raw material costs, but to add insult to injury, we have to pay to have it transported, sometimes in multiple steps. First to the recycling bin, then consolidated with other scrap plastic then finally picked up by a recycling or disposal service and transported to its final destination.

    This is a form of transport waste that can cost big bucks.

  5. container storage Gold Coast Avatar

    For products that are small or similar in nature, container storage allows for bulk storage and retrieval. This method is particularly useful for fast-moving items or items that need to be picked and shipped quickly.

Leave a Reply

Your email address will not be published. Required fields are marked *