In 1949, the US Military issued MIL-STD-1629, titled Procedures for Performing a Failure Mode, Effects and Criticality Analysis. It was reissued and reprinted numerous times thereafter. In practice, people refer to the method described in the MIL Standard as FMEA, often with a prefix: DFMEA for Design FMEA, PFMEA for Process FMEA and the like. FMEA is one of the AIAG Core Tools and thus it is widely used by automotive industry suppliers. The method is also described in SAE, IEC, and other standards. In its various forms FMEA is meant to help organizations identify risks and allocate resources to address said risks. In essence, an FMEA answers the following three questions.
- What has gone wrong in the past?
- What could go wrong now or in the future?
- What can we do about it right now?
However, there is a catch with the classic approach. Attempts to draw people into an FMEA conversation are often met with resistance and shrieks of agony. Feedback indicates a common theme – people dreaded their past participation in FMEA sessions because of its unwieldy tabular approach. Referring to large spreadsheets with tiny fonts, people comment with terms like “tedious” and “bewildering” and phrases like “it took forever” and “there must be a better way.” Of course, for the Lean Thinker, these comments point clearly toward an improvement opportunity. With that in mind, we will review an alternative: a visual Process FMEA that has been used successfully for non-regulated risk assessments.
Alternate method for PFMEA
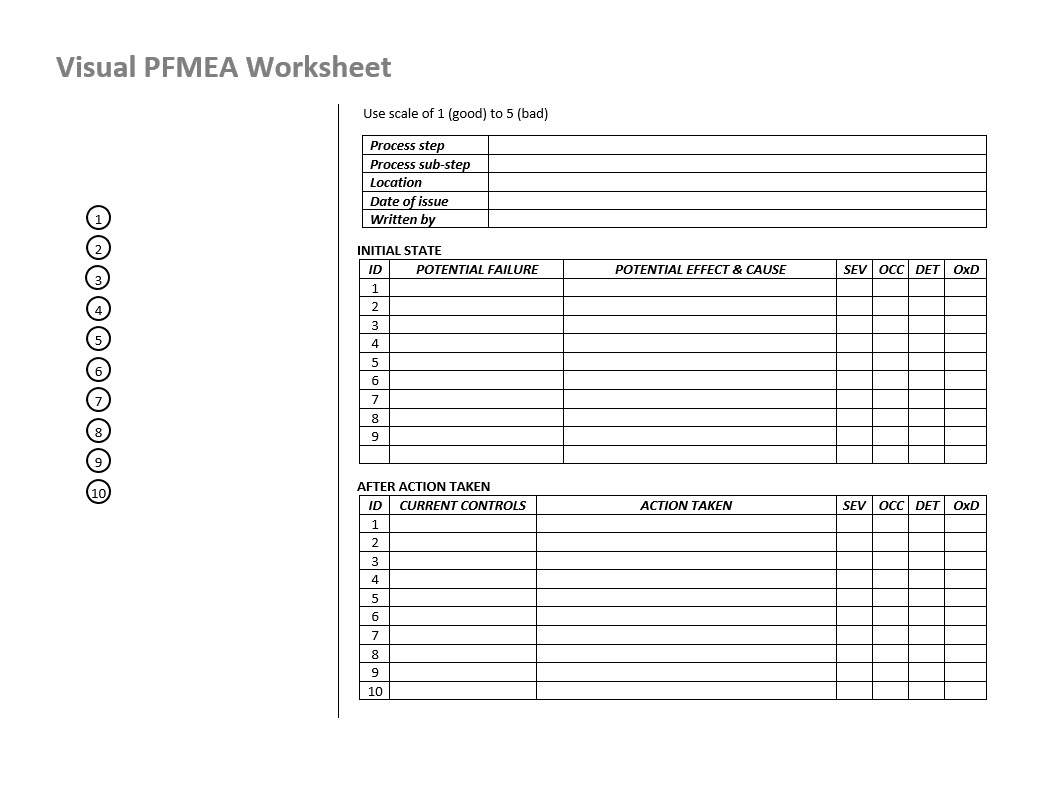
The alternate method differs from the formal method in several ways. First, the approach is highly visual, relying on at-Gemba observations augmented by a series of process videos or photographs. Second, processes are broken down into sub-components. Third, a scale of 1-5 is used instead of a scale of 1-10. Fourth, the RPN calculation is not used.
To start, a group is assembled, they head to the production area and define a subset of the process to study. An appointed FMEA Scribe (usually a Lean Six Sigma Black Belt, Process Engineer or Quality Engineer) takes videos or photos, documents participant insight, and defines present system controls. This initial step answers the questions about past issues and potential future issue. Here is an example of the first phase:

Notice the differences compared to the classic method. The FMEA Scribe prepares a simple 1-page document with an annotated photograph. Sequential numbers highlight the areas of concern. A small table is used to establish the initial state of the process. Severity, Likelihood of Occurrence and Detectability are all rated by the group on a scale of 1-5. Unlike the RPN value, the calculated rating for the alternate method is simply the Likelihood of Occurrence times Detectability (OxD). The reason: in the second step, the Severity Rating will not change, it is what it is.
The second step in the process answers the third question (What can we do about it right now?) and provides a framework for immediate action. In this example, the team decided to build a simple lineside repair station, re-write purchasing specifications, install low-cost fiber break detectors (a fine example of process Jidoka) and take other actions to help production operators make things better, faster, and cheaper.

The second table records the actions taken and the updated numerical scores determined by the FMEA team. A comparison of the initial state OxD scores (2-6-1-6-2-1) to the after-action scores (1-2-1-2-1-1) provide an immediate feel for the effectiveness of the changes.
While this method is admittedly not for everyone, it is simpler and more collaborative than the classic approach. The focus is on the process itself and not on a spreadsheet. The people that work within the process participate, giving them a stake in the improvement effort. People collaborate and learn together. The rating system and calculations are simplified and much easier to understand. Done right, business risks are made visible and addressed before disaster strikes.
Next week: The Visual Safety FMEA
Leave a Reply