A common problem with SPC is that the world appears too complicated for a statistical approach to work. In complex electronics products, for example, circuit boards may have thousands of holes and microchips may have millions of transistors. Plotting control charts of each and every dimension is clearly not feasible. What can be done?
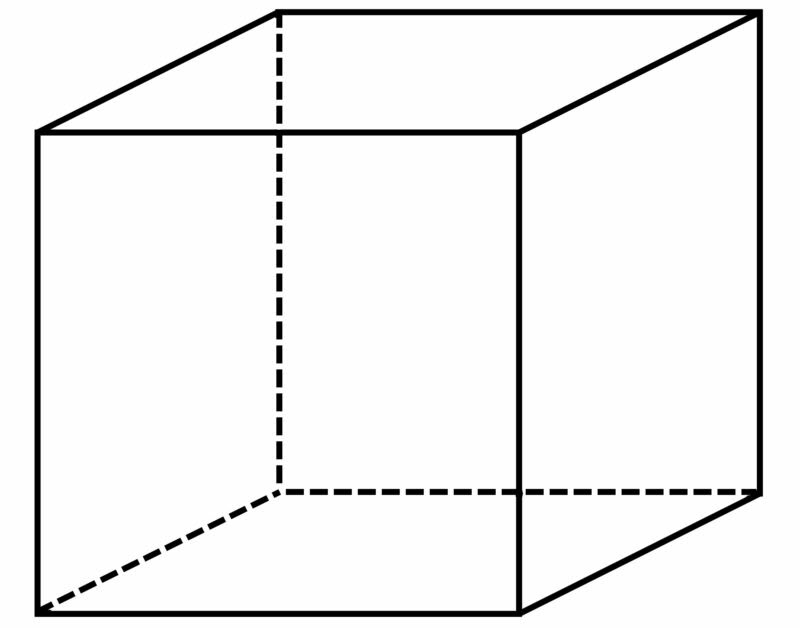
To answer this question, consider a simple product: the box in Figure 1. How many things could we measure on this box?

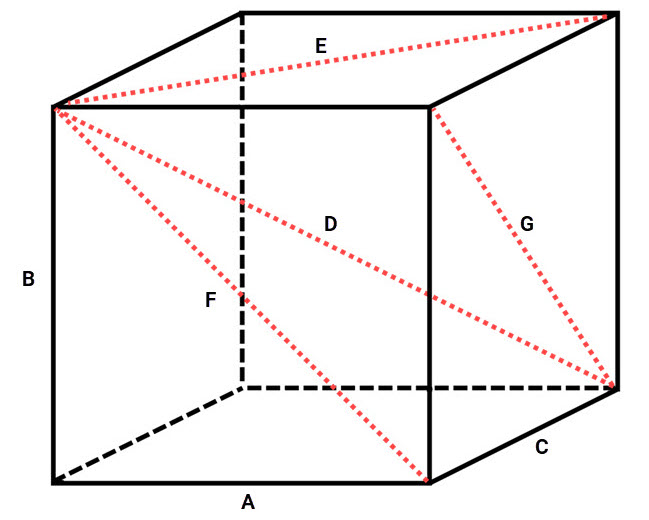
It turns out, a great many. Length, width and height are obvious choices. But we could also measure the diagonals on all six sides, interior diagonals front-to-back and back-to-front, linear combinations of these measurements and a great many more. We could conceivably come up with dozens of measurements on this simple box.
But—and this is critical—we don’t need these measurements to control the box process. The “P” in SPC stands for process, not product. When we focus on the product, we lose sight of the fact that we’re not trying to control the product. Control of the box process may be a great deal more simple than controlling the product. And if we control the process properly, the product will take care of itself.
The statistical technique known as Principal Components Analysis can help us determine just what is important and what is not. Most statistical software packages can perform PCA. To illustrate the approach, I measured an assortment of boxes (see figure 2). The measurements I obtained are shown (in inches) in Table 1.

| A | B | C | D | E | F | G |
|---|---|---|---|---|---|---|
| 2.63 | 1.25 | 3.44 | 125.00 | 4.25 | 2.88 | 3.63 |
| 3.50 | 0.75 | 3.56 | 5.00 | 5.00 | 3.63 | 3.63 |
| 2.19 | 1.00 | 3.13 | 3.88 | 3.75 | 2.63 | 3.25 |
| 1.81 | 1.00 | 2.56 | 3.25 | 3.00 | 2.00 | 2.75 |
| 13.38 | 2.63 | 23.75 | 26.88 | 27.25 | 13.56 | 23.75 |
| 8.75 | 3.44 | 11.25 | 14.25 | 14.00 | 9.38 | 11.38 |
| 9.63 | 2.13 | 12.50 | 16.00 | 15.94 | 9.75 | 13.00 |
| 4.25 | 4.13 | 8.00 | 9.00 | 9.00 | 5.57 | 8.88 |
| 10.13 | 4.13 | 12.50 | 16.25 | 16.00 | 11.00 | 12.88 |
| 10.75 | 6.00 | 15.00 | 19.00 | 18.38 | 12.25 | 16.00 |
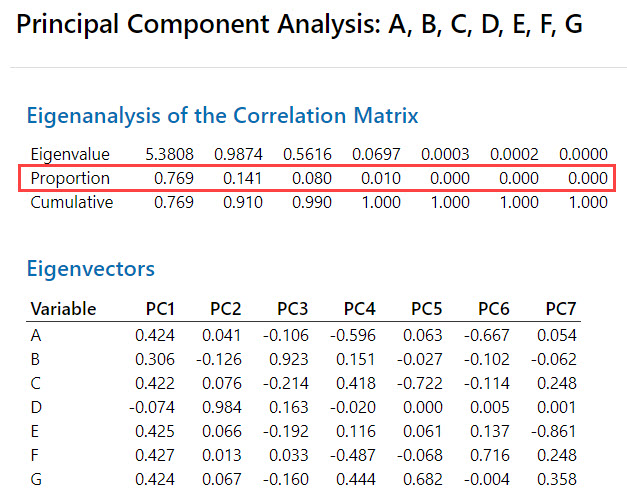
When these data are crunched through PCA, we find that three principal components explain 99 percent of the variation in the data set: Component No. 1 explains 76.9 percent of the variation, component No. 2 explains 14.1 percent, and component No. 3 explains 8 percent of the variation, as indicated on the proportion line in Figure 3.

The PCA clearly shows that these three components are associated with A, B and C respectively. Thus, the “box process” can be characterized almost entirely by controlling these three characteristics. If we do that, the other dimensions will be OK, too.
Principal Components Analysis in the Real World
An example of using this approach in the real world involves CNC machining. A defense plant machined parts for use in guided missiles. The parts were extremely complex, with thousands of holes, cutouts, etc. on each. However, when the data were analyzed using PCA, it was determined that four principal components accounted for nearly all of the process variation. Further study showed which measurements were correlated with each principal component.
From this, the engineers determined that, for all the apparent complexity, the machining process was, in fact, quite simple. The four principal components corresponded with the machining center’s four axes of movement: X, Y and Z movement of the bed, and the rotation of the table on which the parts were mounted. SPC could be accomplished by selecting those features most difficult to position in each axis of movement. Often, a single feature could measure more than one axis; for example, a hole furthest from the “home” position in both the X and Y axes. The result: One or two control charts suffice for the control of a process placing thousands of features.
Note that the features selected for SPC may be of little or no importance to the product itself. In fact, some parts were designed with “process control features” that were later removed from the part entirely. This makes sense when remembering that P stands for process, not product. If you keep that in mind, the complexity you face might just evaporate before your eyes.
Check out our course SPC course to learn more about Principal Components Analysis.


Leave a Reply