A “toe in the water” approach won’t always tell you if Six Sigma will work.
Lately, potential clients have approached me, requesting a sample project to gauge if Six Sigma might work within their organizational structure. I cautioned against this move. Such an exploratory approach only indicates a lack of commitment to the full implementation and success of Six Sigma. Though ideological concerns play a role, there are substantial practical issues with such lukewarm projects. Notably, significant quality enhancements can occasionally have minimal or even zero cost impact on the bottom line. The outcome of these endeavors is often a management convinced that Six Sigma incurs expenses without providing value. This assumption is entirely erroneous, yet it’s an understandable byproduct of the demonstration-based strategy.
Case Study: A Tentative Encounter with Six Sigma
Take, for instance, the case of Sam, a staunch advocate of Six Sigma. After studying its application across various big companies, he was confident it could save his company, let’s call it ACME, a significant amount of money. The senior leadership at ACME, intrigued by the buzz surrounding Six Sigma, requested Sam to execute a trial project to evaluate if the media’s reported savings could indeed be realized at their firm.
ACME’s primary offering was a complex assembly, which it sold to a prominent aerospace client. The assembly-manufacturing process was statistically controlled and averaged 10 defects per assembly. With management backing him, Sam calculated the noncompliance cost to be roughly $1,000 per assembly. Following months of rigorous work, Sam’s Six Sigma team successfully redesigned the process, reducing defects by a remarkable 50 percent, from 10 to just 5 per assembly.
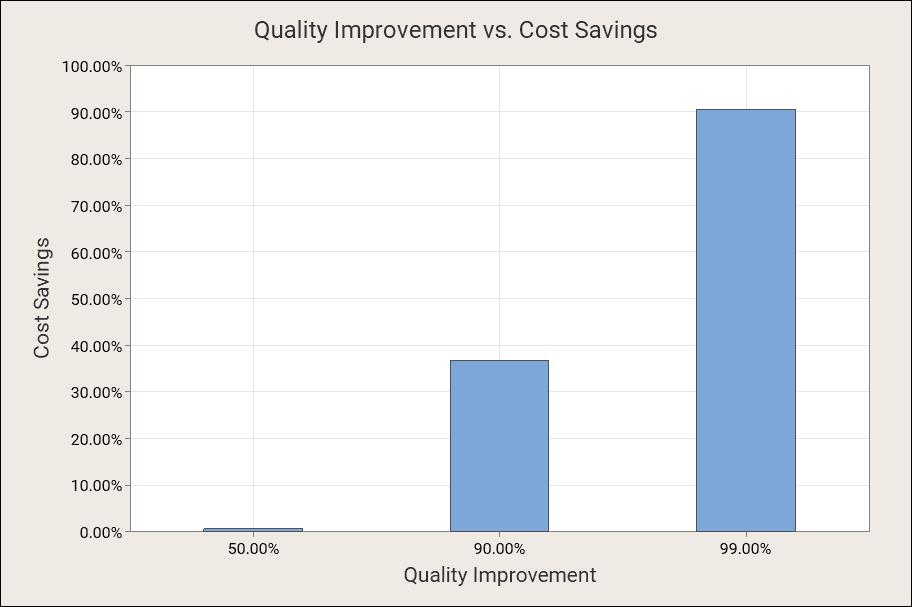
However, the accounting department’s vigilance over the assembly costs revealed a mere 0.7% cost saving, much to everyone’s surprise. Consequently, management deduced that quality enhancements didn’t pay off, thus deciding not to further pursue Six Sigma.
Did the accountants miscalculate? The answer is no. The issue was that Sam equated quality with the number of defects. The fact is, most costs are due to defectives and not individual defects. (Credit to Mikel Harry for this insight.)
A defective is an assembly or service containing one or multiple defects. The specific number of defects is largely irrelevant as customers typically respond to defective units by seeking warranty repairs, refunds, or other options. Internally, identifying defective units requires expensive inspections and subsequent costly reworks or complete scrapping. A unit containing a single defect is nearly as expensive as one with multiple defects.
The relationship between defects and defectives can be mathematically described by the Poisson distribution, represented by:
P\left( x \right) = \frac{ \mu ^x{e^{ - \mu } }}{{x!}}In this equation, ‘x’ signifies the number of defects in the sample, and P(x) is the probability of finding ‘x’ defects. For instance, P(1) is the likelihood of finding one defect. The symbol μ represents the average number of defects per product or service unit.
For Sam’s project, prior to the Six Sigma application, each assembly averaged 10 defects, thus μ=10. The Six Sigma team’s efforts reduced the defect average per assembly to 5, marking a 50% improvement in quality.
Inserting these figures into the equation gives us the probability of an assembly being defect-free, denoted as P(0), for each of the two quality stages. Before Six Sigma, with μ=10, we have:
P\left( 0 \right) = \frac{ 10 ^0{e^{ -10 } }}{{0!}}=e^{ -10 }=0This suggests there were virtually no defect-free assemblies prior to the Six Sigma implementation. After applying Six Sigma, the probability of ACME producing a defect-free assembly was:
P\left( 0 \right) = \frac{ 5 ^0{e^{ -5 } }}{{0!}}=e^{ -5 }=0.7\%As such, a 50% quality improvement, as measured in defects, only resulted in a 0.7% increase in the production of defect-free assemblies. The entire relationship is graphically illustrated in Figure 1.

Substantial cost-saving benefits start to materialize only when quality attains exceptionally high levels. This relationship clarifies why quality enhancement programs often don’t deliver immediate returns. Only when companies remain dedicated and approach Six Sigma quality standards do they reap the expected results. Regrettably, these “dip a toe in the water” projects frequently deter companies from truly embracing Six Sigma before they’ve even started to make significant strides.


Leave a Reply