A case study from the manufacturing sector showcases the advantages of data mining and artificial neural networks.
In a prior discussion, I outlined the process of implementing a virtual design of experiments (VDOE) using artificial neural networks and data mining techniques. Today, we delve into a practical instance from the manufacturing realm that underlines how these methodologies can be employed in everyday scenarios.
Our case study stems from a soldering process, specifically the data displayed in Table 1. This information was not procured specifically for an experiment but was casually collected during regular process operations. Statisticians often term such data as “happenstance data”. This kind of data, collected without controlled conditions, is prone to numerous unknown factors that challenge its credibility. Therefore, it’s not advisable to derive conclusions solely based on happenstance data analysis. However, considering the substantial resources most organizations spend to gather this information, disregarding the knowledge available in the data warehouse merely because it’s not flawless would be wasteful.
| PH Time | PH Distance | Defects |
|---|---|---|
| 38 | 22.5 | 15 |
| 40 | 20 | 13 |
| 40 | 25 | 16 |
| 45 | 17.5 | 15 |
| 45 | 22.5 | 5 |
| 45 | 26 | 11 |
| 50 | 20 | 12 |
| 42 | 22.5 | 10 |
| 50 | 25 | 3 |
| 42 | 22 | 11 |
| 46 | 22 | 4 |
| 55 | 25 | 4 |
| 55 | 21 | 17 |
| 55 | 25 | 15 |
| 50 | 24 | 3 |
| 49 | 25 | 3 |
| 57 | 37 | 10 |
| 35 | 25 | 20 |
| 45 | 37.5 | 17 |
| 30 | 20 | 27 |
| 30 | 22.5 | 33 |
| 30 | 25 | 37 |
| 30 | 27.5 | 50 |
| 30 | 37.5 | 57 |
| 50 | 20 | 13 |
| 50 | 22.5 | 5 |
| 50 | 25 | 3 |
| 50 | 30 | 5 |
| 50 | 14 | 12 |
| 50 | 37.5 | 14 |
| 50 | 45 | 16 |
| 50 | 50 | 40 |
| 60 | 20 | 35 |
| 60 | 25 | 18 |
| 60 | 37.5 | 12 |
In terms of data mining, my proposition is to utilize this information more as an inquiry tool rather than a source of definite conclusions. The queries brought up by the data mining analysis can be further scrutinized through preliminary projects and statistically designed experiments (DOE) under controlled circumstances. The following are some illustrative questions:
- What are the likely crucial variables? (These variables can aid in designing factorial or screening experiments.)
- What’s the estimated impact of modifying a specific variable by a given measure? (This impact can be employed to determine high, intermediate, and low settings for the experiment.)
- Is there a combination of variables that disrupts the process? (This kind of combination can help in deciding the experimental region to study or the type of experimental design to use.)
These questions can be partially addressed via data mining. Among many data mining techniques, artificial neural networks are one viable option. The findings from the data mining can then feed into the DOE process.
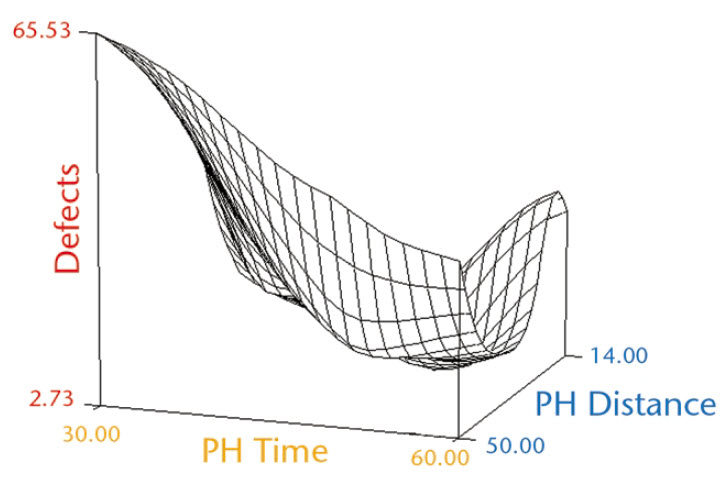
Using the data from Table 1, I trained and validated a neural network. The variable PH Time indicates the preheat time in seconds, PH Distance represents the distance from the board to the preheat element in centimeters, and Defects signify the coded number of defects per unit. The model generated by the neural network is depicted in Figure 1.

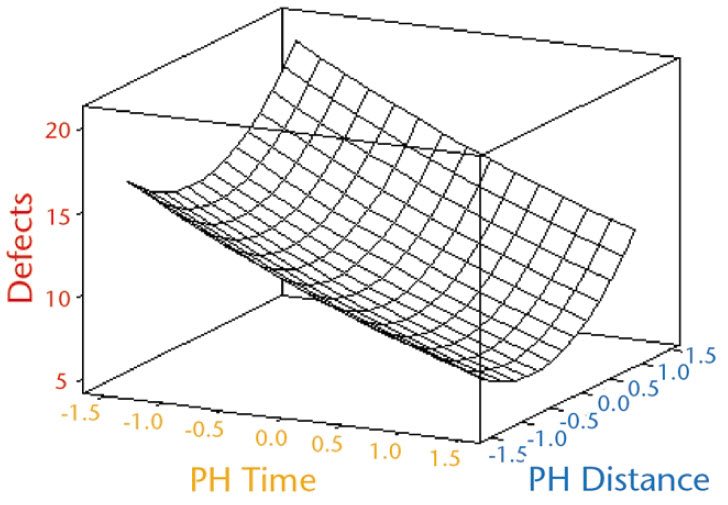
Drawing a comparison between the neural network model and the response surface model (RSM) resulting from traditional DOE methods proves insightful. The RSM is demonstrated in Figure 2, where the variable PH Time signifies the circuit board’s preheat time in seconds and variable D represents the distance from the preheat element in centimeters. In this RSM, the zero point for PH Time is 45 seconds, and for PH Distance, it’s 22.5 centimeters. The surface outlined by the neural network differs slightly, but both models guide the settings for PH Time and PH Distance to similar levels and predict comparable defect rates.

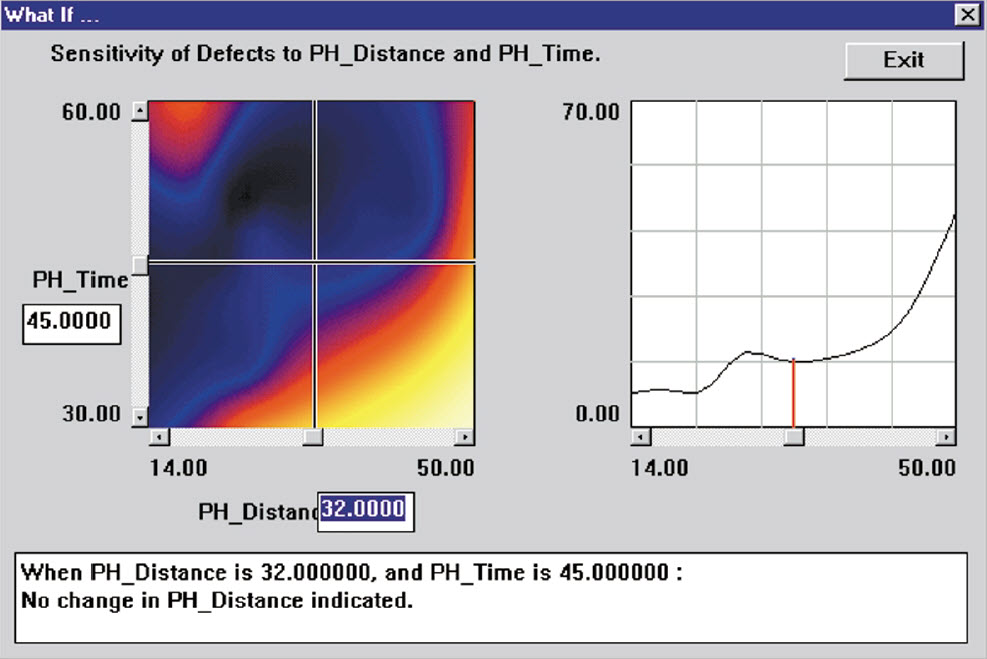
Neural network software offers the capability for “What if?” analysis, as demonstrated in Figure 3. With “What if?” functionality, you can implement virtual DOE, designing appropriate experiments just as you would in actual scenarios. However, instead of using inputs to run experiments on the real process, you feed them into the neural network’s “What if?” analysis. The outcomes from the neural network are evaluated as you would assess the results of tangible experiments. Essentially, they are input into your DOE software, and conclusions are drawn from the results.

Given that I constructed the model using happenstance data, it’s crucial to validate the results. DOE methods used on the actual process can provide the necessary experimental validation; the model should serve as the initial point for these experiments. If the data is indeed valid, the neural network-based VDOE will kick off the experiment much closer to the optimum, significantly minimizing the amount of real-world experimenting needed. The resultant cost savings will enable more experiments within your DOE budget, thereby facilitating quicker improvements.
References:
Berry, Michael J.A. and Linoff, Gordon. Data Mining Techniques: For Marketing, Sales, and Customer Support, New York: John Wiley & Sons, 1997.

Leave a Reply