-
Measurement Error Kills Macho B
If you live in Arizona, you’ve probably heard of Macho B. Macho B was believed to be the last surviving jaguar in North America. Southern Arizona is at the extreme northern boundary of the jaguar’s range and it was believed that no jaguars remained north of the United States border with Mexico. However, a snare…
-
A Discussion of R-Square and S
Question from a Lean Six Sigma Black Belt Student When selecting a model two of the criteria say that the Standard Error be small and R Square be large. Since R Square is a proportion, one might think that the usual 95% would be the threshold — correct? Answer It may be surprising, but most of…
-
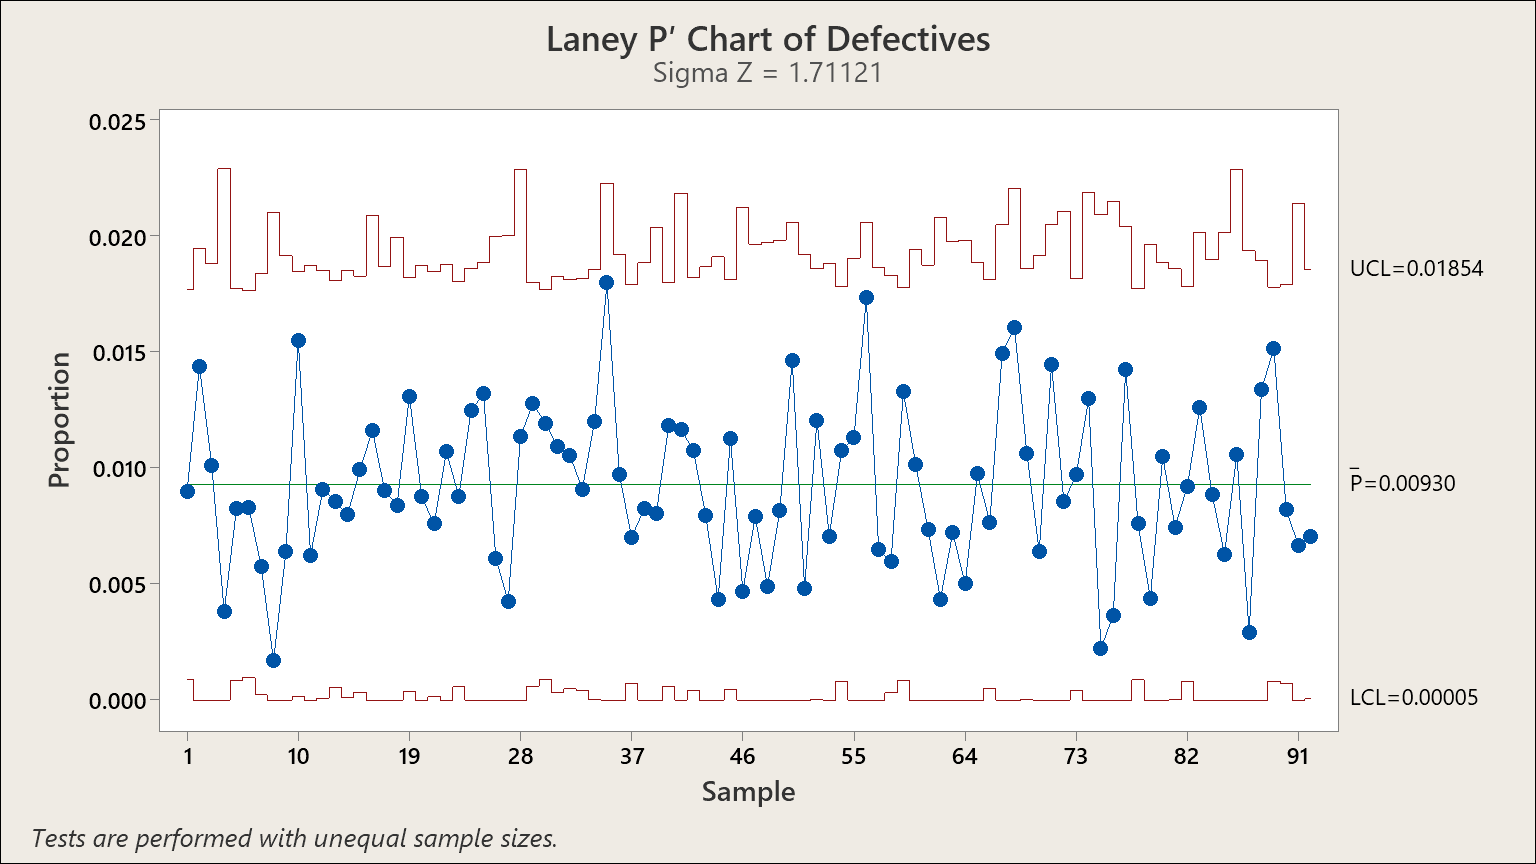
Elevating Six Sigma: The Power of the Laney P’ Chart
In the realm of quality control and Six Sigma methodologies, the significance of statistical process control (SPC) cannot be understated. Central to these applications are control charts which provide a visual tool for studying process variation over time. A critical addition to this statistical toolkit is the Laney P’ Chart. Traditional Control Charts: An Overview…
-
A Sampling Question
A Six Sigma Green Belt student asked an interesting question about sampling. Here’s the question and my response. QUESTION: Just a question that I thought I would run by you… I work in the Automation industry, and am currently working on two production lines, and logging data for the parts being produced. One line is…
-
Kurtosis
A student asked me if the kurtosis of the normal distribution was 0 or 3. It seems that I’d said both at different times. Strangely, the answer is that kurtosis of a normal distribution is sometimes 0 and sometimes 3. If you look at Wikipedia you see this old-timer equation for Kurtosis, where μ4 is…
-
Non-Normal Capability and Negative Z Scores
Here’s a question from a Pyzdek Institute Six Sigma Green Belt student: Question: I’m currently looking at data for my Green Belt project. The primary metric is turn-around-time, and the data is non-normal. I have run the Distribution ID plot and determined that the closest fits for my data are a Weibull distribution and a…
-
How to Lie With Statistics-Schwab Chart
Normally when the bottom axis represents time periods, the more recent time periods are on the right side. Not so with this graphic of Schwab U.S. Treasury Money Fund dated April 30, 2010. On this chart the most recent period is on the left, not the right. Nice try Schwab! When using graphics in quality…
-
A Question of Sampling
A reader asks “I want practice to SPC method to know whether my production process is in control, in case of all data available is from batch to batch, is it rational to construct the sub-group based on batch to batch data? What conclusion can I get from batch to batch? Any suggestion? Thank you very much.”…
-
Design of Experiments Examples in Healthcare
In regard to Design of Experiments applications in healthcare, consider the randomized clinical trial. These are simple Designed Experiments. Usually they are one-factor-at-a-time (OFAT) experiments that attempt to isolate the effect of one drug across a population. Screening experiments would allow the assessment of multiple factors simultaneously with relatively small sample sizes. Since the OFAT…
-
What the Heck is Multicollinearity?
A Lean Six Sigma Master Black Belt was perplexed by the software’s correlation and regression analysis output. The results were pure nonsense. In addition to regression coefficients that were negative when common sense told him they should be positive (and vice versa), some of the correlation coefficients were large, while the corresponding regression coefficient p-values…