
An excerpt from my latest book, Everything is a Process. Available on Amazon.
I have twenty potential projects at my company. Which are the ones that provide the greatest benefit to the company and should be completed first?
Most people have heard a quote similar to that above. Where is the best place to spend effort to achieve results? This simple Excel tool provides a way of visually seeing all the projects and the value they bring based on a set of benefit and effort questions that are completed by a team of people in your organization.
Start with the Benefit Table
You start by looking at the Benefit Table worksheet. This table defines seven different benefits of a project.
- Revenue enhancement ($) – Will this positively impact the revenue of the company?
- Reduce Cost or Cost Avoidance within Company – Will this reduce costs within the Company by decreasing or avoiding time, labor, supplies, travel?
- Increase speed of delivery – Will this improve our ability to deliver results to our customers faster?
- Strategic Importance – Is this aligned with the Company strategy?
- Amount of Client Services “Pain” – What is the level of negative impact the process currently has on client services?
- Client Value – Does this deliver additional value to our clients? Or does this deliver savings to our client?
- Business Unit Impact – What is the scope of the project/project impact across business units?
Benefit Priority Worksheet
Benefit – for each of the below measures, rate the relative impact that the project will have on the respective measure by rating as 0, 3, 6 or 9. Benefits are annualized.
| Measure | Description | 0 | 3 | 6 | 9 |
|---|---|---|---|---|---|
| Revenue enhancement ($) | Will this positively impact the revenue of the Company? | No impact | Small < $500,000 | Medium $500,000 – $5,000,000 | Large > $5,000,000 |
| Reduce Cost or Cost Avoidance within Company | Will this reduce costs within the Company by decreasing or avoiding time, labor, supplies, travel? | No impact | Small < $50,000 | Medium $50,000 – $500,000 | Large > $500,000 |
| Increase speed of delivery (i.e., process bills faster) | Will this improve our ability to deliver results to our customers faster? | No impact | Small | Medium | Large |
| Strategic Importance | Is this aligned with the Company product strategy of. Insert your strategy such as: reducing cost, increasing speed, reducing errors, regulatory, etc. | Not linked to product or strategy | Linked to two items | Linked to three items | Linked to all four items |
| Amount of Client Services “Pain” | Level of negative impact process currently has on client services | No impact | Small | Medium | Large |
| Client Value | Does this deliver additional value to our clients? OR Does this deliver savings to our client? | Client not aware of any additional value | Client sees that this will add value to their offering from the company | Client considers this critical as it brings great value to there offering from the company. Without this, there is a potential for client attrition. | Client considers this critical. Without this, client attrition is eminent. |
| Business Unit Impact | The scope of the project/project impact across business units | No impact | Impact across two departments in a single business unit | Impact on an entire Business Unit | Impact across two or more Business Units |
Rank each of these benefits for your projects. The ranking is a score of 0, 3, 6, or 9. For example, revenue enhancement is broken out as follows:
- Score of 0 – no impact
- Score of 3 – Impact < $500,000
- Score of 6 – Impact > $500,000 and < $5,000,000
- Score of 9 – Impact > $5,000,000
In this example, with an expected benefit of greater than $5,000,000 it would be scored as 9. If the trigger values do not work for your organization, change them to be more meaningful. For example, maybe $5,000,000 is too much and $700,000 would be more appropriate as the highest figure. Then change the trigger values to fit. You do this for each of the benefits shown in the table.
Effort Table
Next, you want to review the Effort Table. The effort table describes six different types of effort:
- Personnel Requirements – What are the average number of FTE’s (full time equivalent people) required to execute the project (independent of project duration)
- Project Duration – what are the number of weeks from start date to end date of the project?
- Budget Available – Are there budgeted funds available to support this effort?
- Capital Investment ($MM) – Are there any incremental capital expenditures or other costs that are required to implement the project?
- Risk Projection – What is the probability of not succeeding due to issues with respect to schedule, budget, customer requirements, etc.?
- Business Unit Impact – What is the effort and coordination required across departments and Business Units?
Effort – For each category below, rate the relative level of effort (using a 0, 3, 6, or 9) required to meet the projects requirements. Lower scores Indicate that less effort is required.
| Measure | Description | 0 | 3 | 6 | 9 |
|---|---|---|---|---|---|
| Personnel Requirements | The average number of FTEs (full time equivalent people) required to execute the project (independent of project duration) | 1-3 | 3-6 | 6-12 | >12 |
| Project Duration | The number of weeks from start date to end date of the project. | < 6 weeks | 7-12 weeks | 13-25 weeks | 26 weeks |
| Budget Available | Are there budgeted funds available to support this effort? | Fully covered in current baseline budget | Business case funded by $ in the baseline budget | Budget approved but not yet funded | No current funding |
| Capital Investment ($MM) | Are there any incremental capital expenditures or other costs that are required to implement the project? | No capital | Small <$1,000 | Medium $1,000-$10,000 | Large >$10,000 |
| Risk Projection | What is the probability of not succeeding due to issues with respect to schedule, budget, customer requirements, etc.? | None | Low | Medium | High |
| Business Unit Impact | What is the effort and coordination required across departments and Business Units? | None | Two department in a single Business Unit | Entire Business Unit | More than one Business Unit |
For example, personnel requirements are defined as follows:
- Score of 0 – 1-3 people
- Score of 3 – 3-6 people
- Score of 6 – 6-12 people
- Score of 9 – > 12 people
If the project requires 7 people it would be scored as a 6. You continue this activity for each benefit in the table.
Project Rating Worksheet
Copy your scores into the project rating worksheet. There is a weighting factor shown in red at the top of each column that I use as a default. If you want more exact weighting factors for your business, I suggest you perform the Analytical Hierarchy Process to calculate your own.

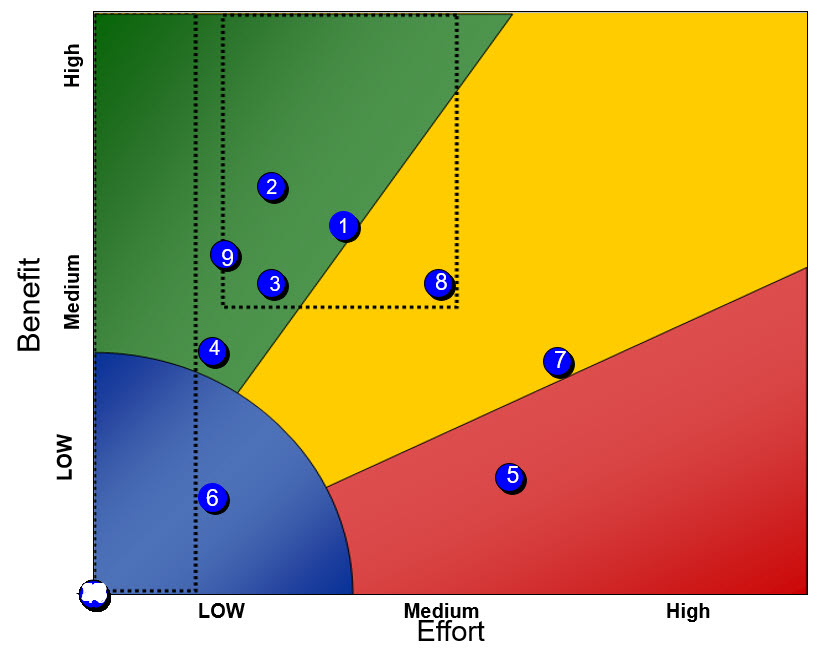
Benefit/Effort Chart
Once you have your scores in the project rating worksheet the software will automatically plot each project. The results will look something like what is shown in Figure 2. Now you have your projects in a pictorial format showing the benefit and effort for each project. The dotted box in the top middle represents the sweet spot. These are projects that are low to medium effort with medium to high benefit. The dotted box on the far left identifies those projects which would be suitable for a Kaizen effort (very low effort). Projects 1, 2, 3, 8 and 9 should be executed first. Projects 5 and 7 have little value and may not be done at all, unless they are regulatory or quality related. Project 4 may be a candidate for a Kaizen event.
Leave a Reply